HyperPush X HyperPush X Docs
Browse 14 Guides
Index ▾

Analytics, Real-Time Traffic & CTR Reporting

📁 User Guides 🕐 Updated 54 minutes ago
Analytics, Real-Time Traffic & CTR Reporting

Real-time analytics and reporting are essential for understanding subscriber engagement, optimizing campaign messaging, and measuring return on investment (ROI). HyperPush X tracks every push dispatch, subscriber click, and delivery event live as it happens across all registered domains.

You can monitor performance metrics in two places:

  1. HyperPush X Web Console (/dashboard & /campaigns): Real-time traffic visualizers, subscriber growth trends, and granular per-campaign CTR auditing tables.
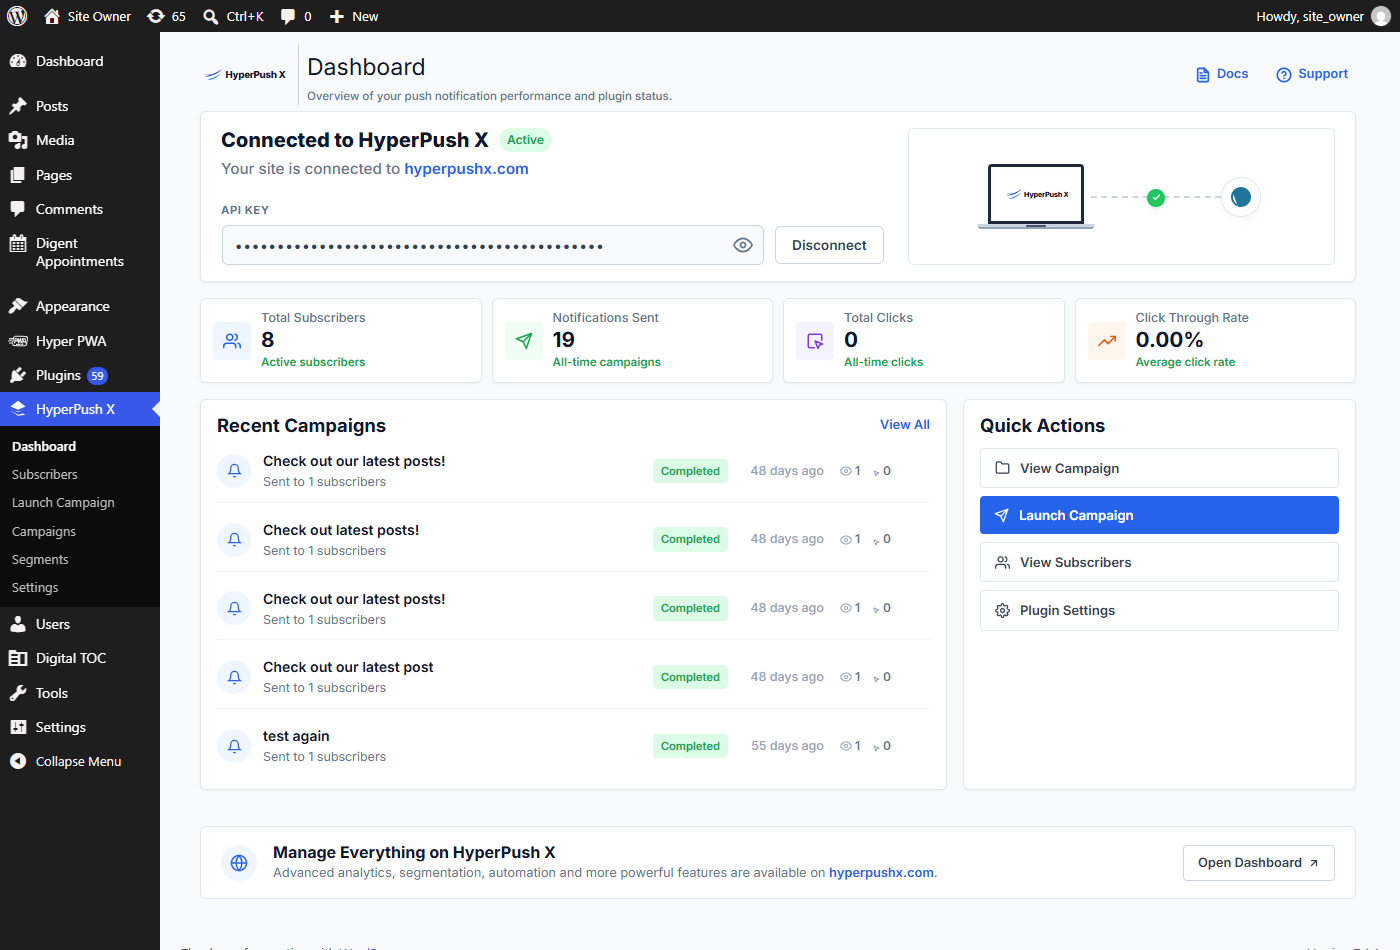
  2. HyperPush X Pro WordPress Plugin (WP-Admin): In-dashboard performance cards displaying live subscribers, total dispatches, total clicks, and average CTR % directly inside WordPress.
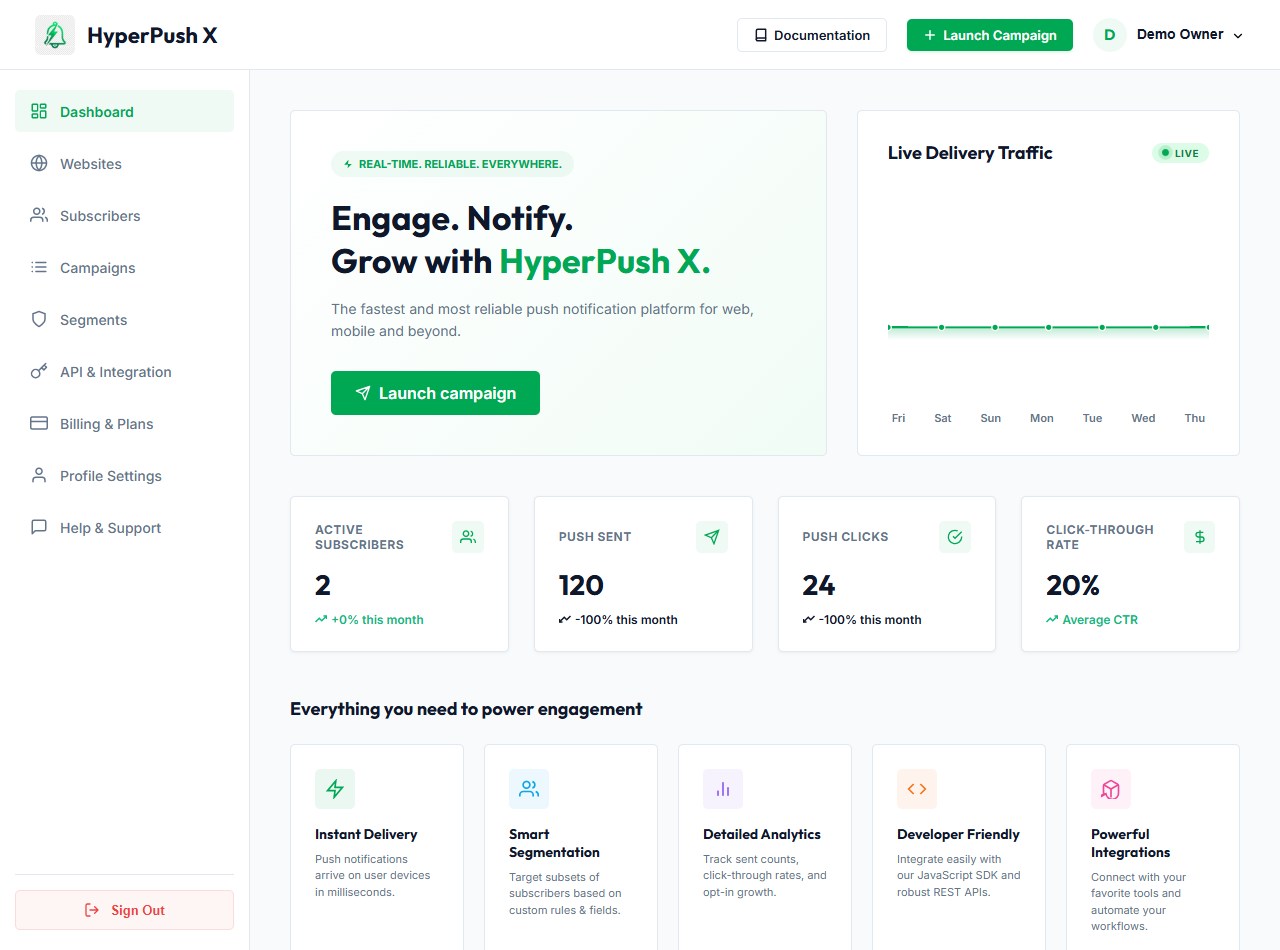
📷 Live System Interface: Web Console Main Analytics Overview

HyperPush X Web Console Main Analytics Overview

📷 Live System Interface: WordPress Site Dashboard Analytics (Dedicated WP Plugin)

If your website is built on WordPress and using our dedicated HyperPush X Pro plugin, monitor performance directly in WP-Admin: WordPress Plugin Dashboard Analytics
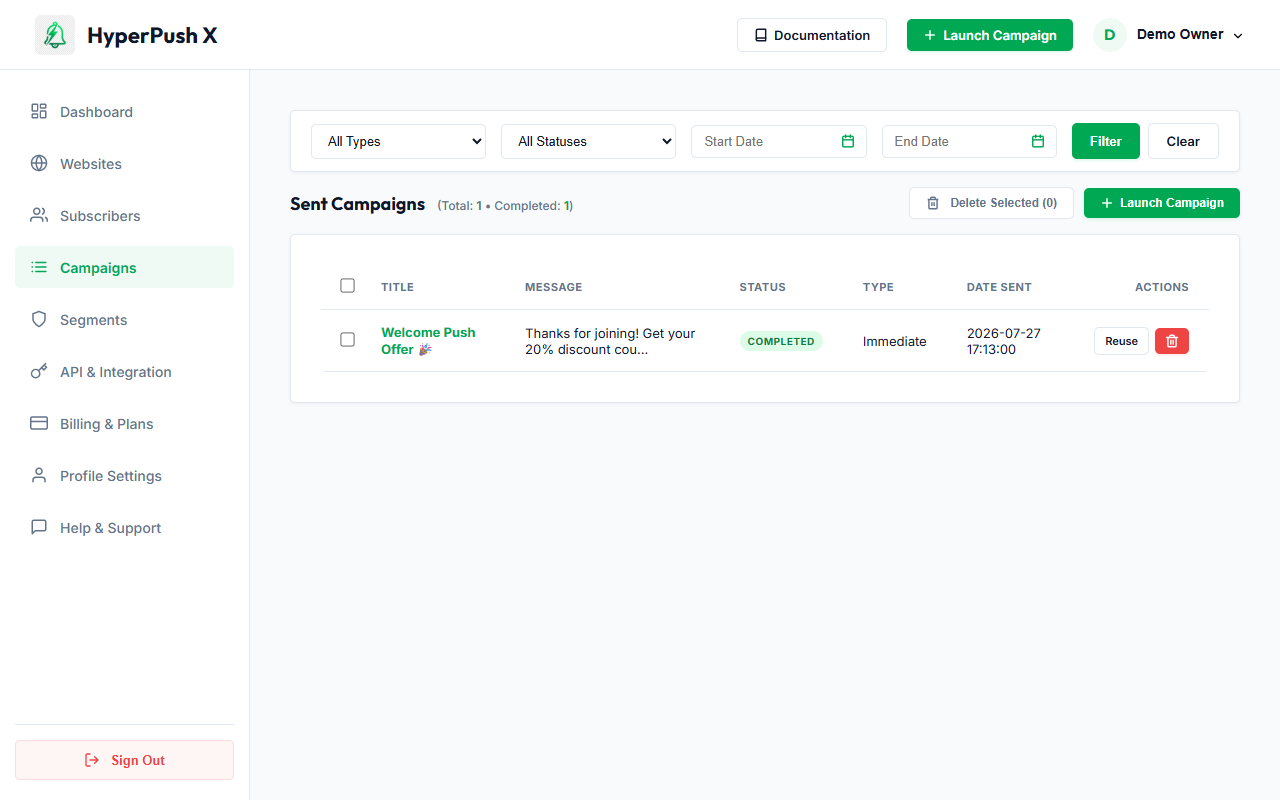
📷 Live System Interface: Granular Campaign Analytics Logs

Web Console Campaign Analytics Logs

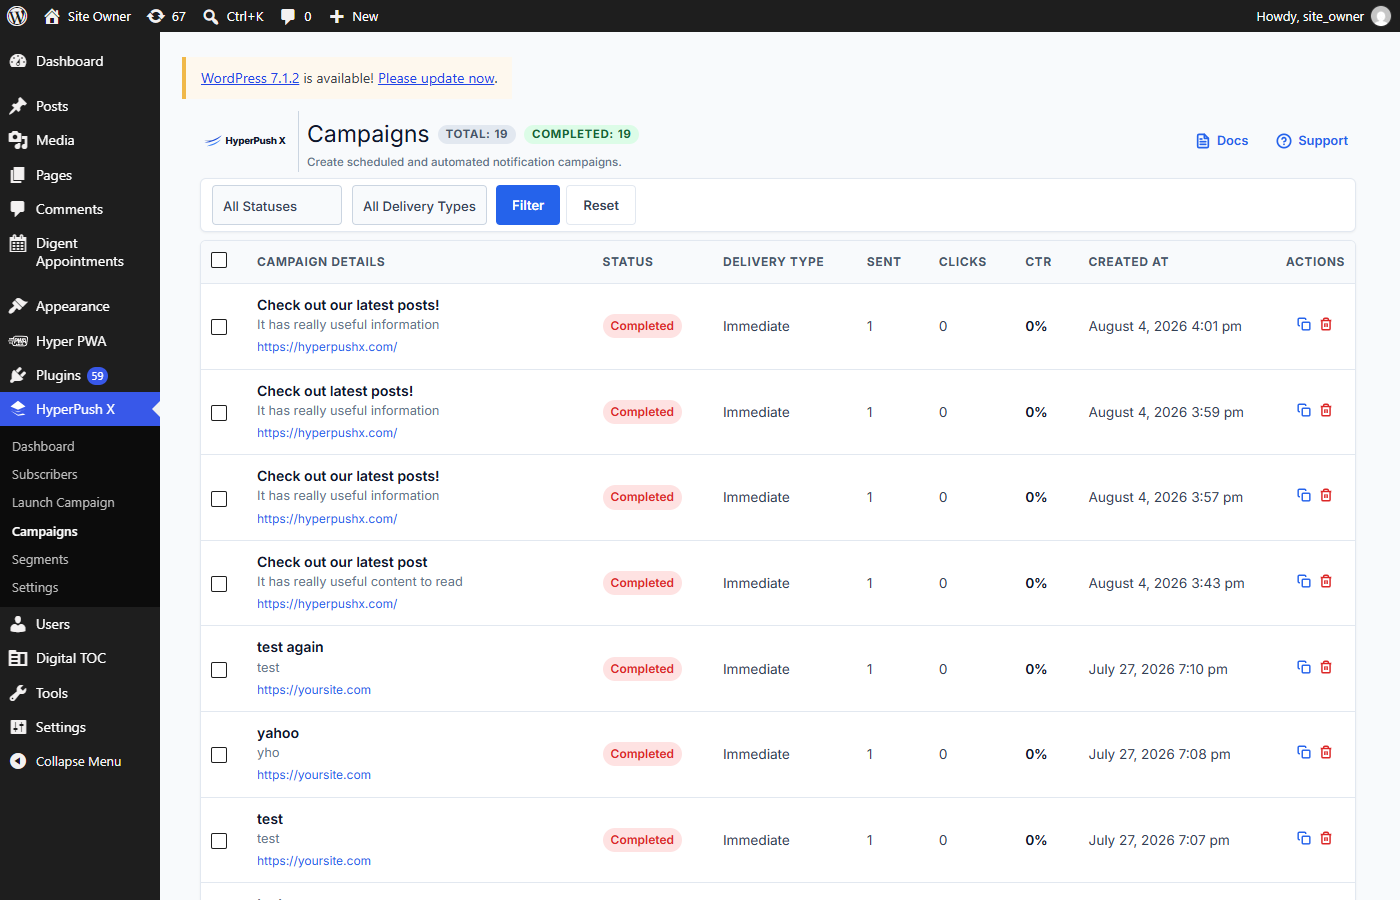
📷 Live System Interface: WordPress Site Campaign History Logs (Dedicated WP Plugin)

If your website is built on WordPress and using our dedicated HyperPush X Pro plugin, audit campaign delivery in WP-Admin: WordPress Plugin Campaign History
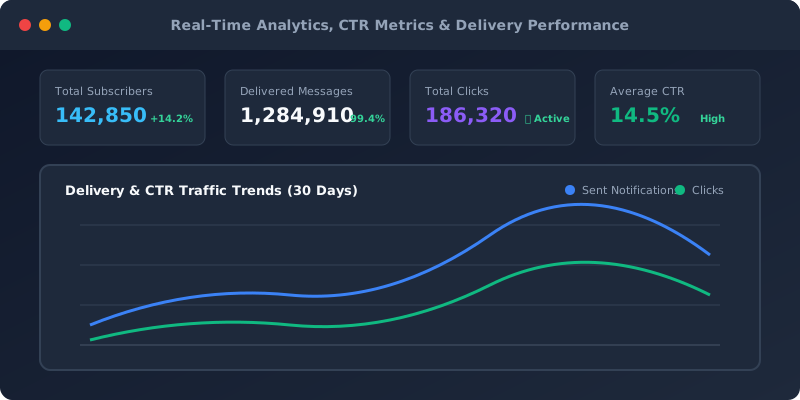
📐 Performance Metrics Architecture

Analytics Dashboard Step


📊 Core Performance Metrics & Key Performance Indicators (KPIs)

HyperPush X tracks four primary performance indicators on your analytics dashboard:

1. Active Subscribers

  • Definition: The total count of live, reachable browser push endpoints currently registered for your website.
  • Why It Matters: Represents your active push audience reach across desktop and mobile devices.

2. Push Sent

  • Definition: Total push notifications successfully dispatched across all manual broadcast campaigns, automated drip sequences, and WordPress post publish alerts.

3. Push Clicks

  • Definition: Total unique clicks registered when subscribers tap your push notification card or click custom action buttons.

4. Click-Through Rate (CTR %)

  • Definition: The percentage of delivered push notifications that resulted in a user click. Calculated dynamically using the formula: $$\text{CTR} = \left(\frac{\text{Clicks}}{\text{Sent}}\right) \times 100%$$
  • Benchmark: Average web push CTR ranges between 10% and 18%, while targeted segmented campaigns achieve 20% to 35%+ CTR.

📈 Monitoring Analytics in Web Console & WordPress Plugin

Method 1: Web Console Analytics (/dashboard & /campaigns)

  • Main Dashboard Cards: View real-time counters for Active Subscribers, Push Sent, Push Clicks, and Click-Through Rate.
  • Live Delivery Traffic Chart: Interactive 7-day visual trend line tracking daily push volume and engagement peaks.
  • Per-Campaign CTR Auditing: Navigate to Campaigns (/campaigns) to inspect individual broadcast performance. The Sent Campaigns table logs title, message copy, dispatch status (Completed, Scheduled), delivery type, dispatch timestamp, sent payload count, click count, and exact CTR %.

Method 2: WordPress Plugin Analytics (WP-Admin)

For WordPress site owners using the HyperPush X Pro plugin:

  • Navigate to HyperPush X -> Dashboard in your WordPress sidebar.
  • Monitor your Connection Status, Active Subscribers, Notifications Sent, Total Clicks, and Click Through Rate live.
  • Audit individual post broadcast logs under HyperPush X -> Campaigns.

💡 Strategies to Improve Push Notification CTR

[!TIP] 1. Attach 2:1 Rich Media Banner Images
Push notifications with high-resolution banner images (800x400px) achieve up to 30% higher CTR on Android and Windows Action Center compared to text-only notifications.

[!TIP] 2. Segment Your Audience
Broadcasts sent to specific segments (e.g. Country equals US or Browser equals Chrome) outperform generic all-subscriber blasts by 3x.

[!IMPORTANT] 3. Add Emojis to Headlines
Emojis at the start of your notification title (⚡, 🎁, 🚀, 🔥) draw immediate visual attention in browser notification trays and increase click rates by up to 25%.

[!NOTE] 4. Optimize Dispatch Timing
Analyze your Live Delivery Traffic chart to identify when your subscribers are most active, and schedule broadcasts to land during peak daytime hours.